Devolution and Local Government Reorganisation (LGR)
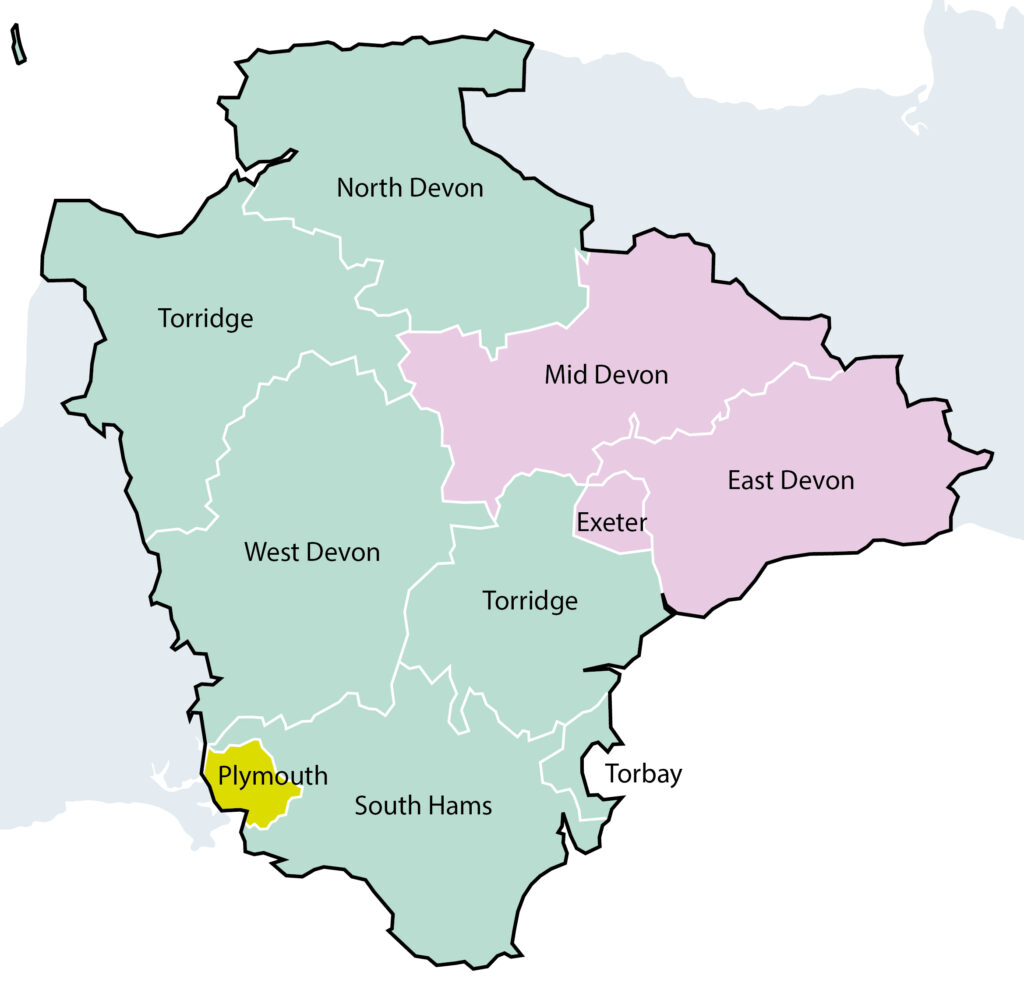
- Plymouth with existing boundaries – shown in
- Greater Exeter, including Exeter, East Devon and Mid Devon – shown in
- Rest of Devon, including Torbay, Teignbridge, North Devon, Torridge, South Hams and West Devon – shown in green.
| Indicator | Plymouth | Greater Exeter | Rest of Devon | England |
|---|
| Population: Total | 268,736 | 377,365 | 595,528 | |
| Population aged 0-15 | 46,112 (17.2%) | 58,488 (15.5%) | 93,209 (15.7%) | 18.5% |
| Population aged 16-64 | 172,023 (64.0%) | 229,148 (60.7%) | 336,772 (56.6%) | 62.9% |
| Population aged 65+ | 50,601 (18.8%) | 89,729 (23.8%) | 165,547 (27.8%) | 18.7% |
| Population Change 2018-2023: Total | + 3,047 (+1.1%) | +25,598 (7.3%) | +19,361 (+3.4%) | +3.2% |
| Population Change 2018-2023: 0-15 | -546 (-1.2%) | +1,727 (+3.0%) | -622 (-0.7%) | +0.9% |
| Population Change 2018-2023: 16-64 | +612 (+0.4%) | +17,558 (+8.3%) | +7,206 (+2.2%) | +2.7% |
| Population Change 2018-2023: 65+ | +2,981 (+6.3%) | + 6,313 (+7.6%) | +12,777 (+8.4%) | +6.9% |
| Area Size (sq. km) | 80 | 1,774 | 4,853 | |
| Population Density | 3,366 | 213 | 123 | 434 |
| Council Tax Base (all) | 123,273 | 174,430 | 292,320 | |
| Gross Value Added | £6.97 bn | £11.80 bn | £12.65 bn | |
| Gross Value Added per worker | £57,315 | £75,653 | £50,256 | £73,390 |
| VAT Reg Business | 6,280 | 15,690 | 27,130 | |
| VAT Reg Businesses per 100 people | 2.3 | 4.2 | 4.6 | 4.1 |
| Income deprived (%) | 14.8% | 8.9% | 12.0% | 12.9% |
| Annual Housing Completions vs Target | 25.1% (324/1,290) | 70.7% (1,809/2,560) | 54.0% (2,544/4,712) | 62.1% |
| Average FT Salary to House Price Ratio | 6.7 (£31.6k/£210.6k) | 9.3 (£34.1k/£318.5k) | 9.9 (£30.5k/£301.0k) | 8.3 (£35.1k/£290.0k) |