Devolution and Local Government Reorganisation (LGR)
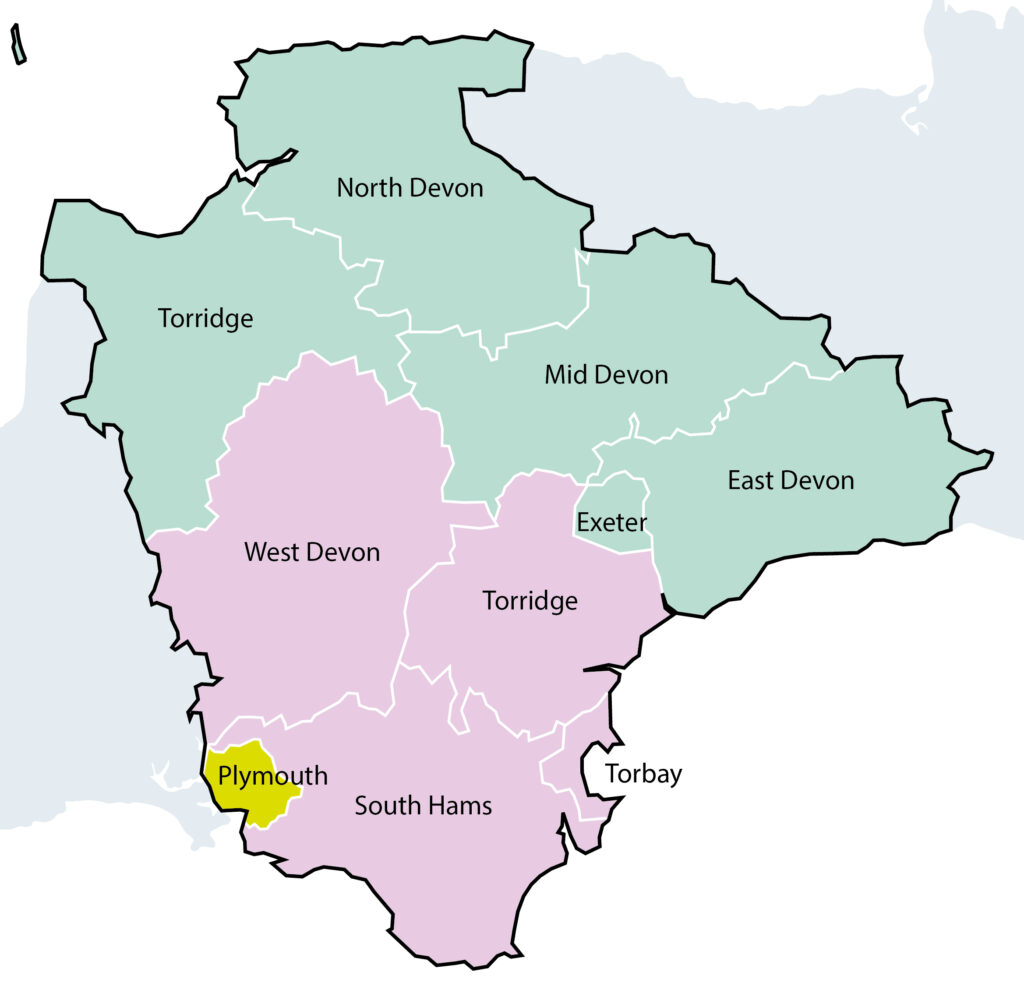
- Plymouth with existing boundaries – shown in
- North East Devon, includes Exeter, East Devon, Mid Devon, North Devon and Torridge – shown in green.
- South West Devon, includes Torbay, South Hams, Teignbridge and West Devon – shown in
| Indicator | Plymouth | North/East Devon | South/West Devon | England |
|---|
| Population: Total | 268,736 | 546,738 | 426,155 | |
| Population aged 0-15 | 46,112 (17.2%) | 85,572 (15.7%) | 66,125 (15.5%) | 18.5% |
| Population aged 16-64 | 172,023 (64.0%) | 324,922 (59.4%) | 240,998 (56.6%) | 62.9% |
| Population aged 65+ | 50,601 (18.8%) | 136,244 (24.9%) | 119,032 (27.9%) | 18.7% |
| Population Change 2018-2023: Total | + 3,047 (+1.1%) | +31132 (+6.0%) | +13827 (+3.4%) | +3.2% |
| Population Change 2018-2023: 0-15 | -546 (-1.2%) | +1453 (+1.7%) | -348 (-0.5%) | +0.9% |
| Population Change 2018-2023: 16-64 | +612 (+0.4%) | +19608 (+6.4%) | +5156 (+2.2%) | +2.7% |
| Population Change 2018-2023: 65+ | +2,981 (+6.3%) | +10071 (+8.0%) | +9019 (+8.2%) | +6.9% |
| Area Size (sq. km) | 80 | 3,844 | 2,783 | |
| Population Density | 3,366 | 142 | 153 | 434 |
| Council Tax Base (all) | 123,273 | 257,864 | 208,893 | |
| Gross Value Added | £6.97 bn | £15.74 bn | £8.72 bn | |
| Gross Value Added per worker | £57,315 | £68,085 | £49,349 | £73,390 |
| VAT Reg Business | 6,280 | 24,450 | 18,370 | |
| VAT Reg Businesses per 100 people | 2.3 | 4.5 | 4.3 | 4.1 |
| Income deprived (%) | 14.8% | 9.7% | 12.2% | 12.9% |
| Annual Housing Completions vs Target | 25.1% (324/1,290) | 67.8% (2,637/3,889) | 50.7% (1,716/3,383) | 62.1% |
| Average FT Salary to House Price Ratio | 6.7 (£31.6k/£210.6k) | 9.4 (£33.0k/£311.5k) | 10.0 (£30.4k/£303.1k) | 8.3 (£35.1k/£290.0k) |