Economic Prosperity, Health and Wellbeing
An increasing population has the potential to impact significantly, both positively and negatively, on economic prosperity and health and wellbeing. There is a need to accommodate and provide for an increasing population through new housing, employment and infrastructure, as well as improved social and healthcare services. Moreover, the proportion of single person households in the UK has increased dramatically in the past few decades, from 12% in 1961 to nearly 30% in 2011 (information sourced from UK National Ecosystem Assessment 2011, synthesis of the key findings, UNEP-WCMC, Cambridge). This trend is likely to continue, leading to pressure to convert more land to housing and increasing per capita demand for water and energy.

In turn, this has the potential to result in negative health and wellbeing impacts for residents through associated externalities such as air pollution and reduced access to tranquil, open spaces. In addition, Devon and Torbay’s economies have significant tourism sectors that employ around 46,000 people and are worth over £2.1 billion annually. Like all economic sectors, these are reliant on the natural environment. A greater population could negatively affect the natural assets enjoyed by residents and visitors through development and urban sprawl if anticipated growth is not managed appropriately.
Population
The population of Devon and Torbay is growing. The 2011 census shows a growth rate of 5.9% in Devon and 0.7% in Torbay over ten years between 2001 and 2011. Whilst these figures are lower than rates within the wider region and nationally within the same timeframe, this trend has the potential to impact negatively on the state of the environment; every additional person needs food, water and energy and produces more waste and pollution. Furthermore, projected population growth to 2031 shows continued growth in both Devon and Torbay which are at a similar rate to the South West but slower than England as a whole (Table 1). It should be noted that locally generated population projections for Devon, based on numbers of planned new dwellings, suggest a population increase of 17.7% between 2011 and 2031 (information sourced from Devon County Council 2013, DCC population projections local model, Strategic Planning Team).
Table 1 – Recorded/projected population (2001-2031)
| 2001 | 2011 | 2031 | change ’01-11′ | change ’11-31′ | |
|---|---|---|---|---|---|
| Devon | 705,600 | 746,900 | 824,800 | 5.9% | 10.4% |
| Torbay | 130,000 | 130,900 | 142,700 | 0.7% | 9.01% |
| South West | 4,943,400 | 5,291,800 | 5,903,700 | 7.0% | 11.6% |
| England | 49,449,700 | 53,013,500 | 60,751,700 | 7.2% | 14.6% |
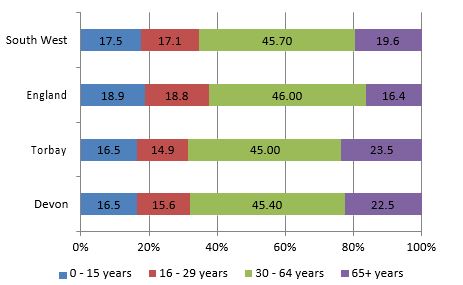
Structure of the population by age group, 2013 (figure 1)
- South West – 0-15 years of age shows 17.5%, 16-29 years of age shows 17.1%, 30-64 years of age shows 45.70%, and 65 + of age shows 19.6%
- England -0-15 years of age shows 18.9%, 16-29 years of age shows 18.8%, 30-64 years of age shows 46%, 65+ years of age shows 16.4%
- Torbay – 0-15 years of age shows 16.5%, 16-29 years of age shows 14.9%, 30-64 years of age shows 45%, 65+ years of age shows 23.5%
- Devon – 0-15 years of age shows 16.5%, 16-29 years of age shows 15.6%, 30-64 years of age shows 45.40, 65+ years of age shows 22.5%
Map 1 – Population Density by Ward
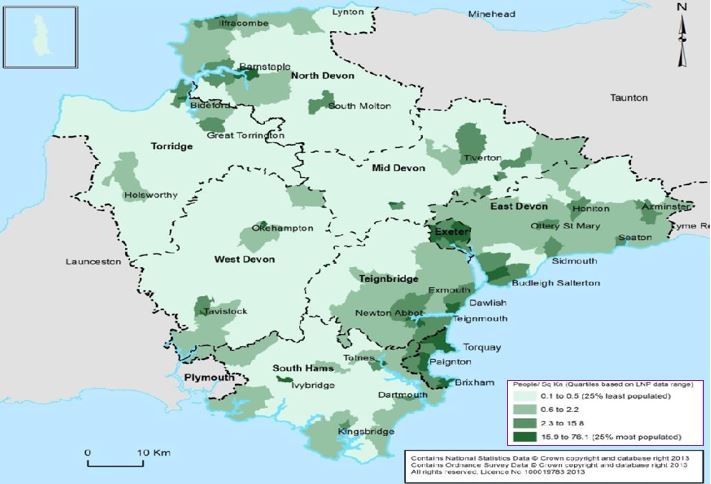
Alongside population growth, population density illustrates where pressures may be greatest on the natural and built environment. Density by ward in Devon and Torbay in 2011 is illustrated in Map 1.(information sourced from the Office for National Statistics 2013 – 2011 census data qs102 – population density. Download available here – Accessed 02/05/2013).
Across Devon, average densities are 1.1 people per hectare, although in the district of Exeter densities rise sharply to 25 people per hectare (the highest of the districts in Devon). In Torbay, densities are 20.8 people per hectare; a marked difference compared to the Devon average. The regional and national average population densities are 2.2 and 4.1 respectively. This demonstrates how rural Devon is, excluding Exeter and Torbay.
Table 2 – Projected percentage change in population by age in Devon by 2031 (2010 baseline)
| Age group | Devon | Torbay |
|---|---|---|
| 0-14 | 4.6% | 5.4% |
| 15-24 | 1.1% | -4.6% |
| 25-39 | -1.7% | 2.0% |
| 40-64 | -7.4% | 12.8% |
| 65-74 | 36.5% | 26.4% |
| 75-84 | 59.0% | 50.9% |
| 85 + | 102.4% | 94.3% |
Table 3 – Ecological footprint (ha per person)
| Area | Percentage % |
|---|---|
| East Devon | 5.47 |
| Exeter | 5.08 |
| Mid Devon | 5.42 |
| North Devon | 5.34 |
| South Hams | 5.77 |
| Teignbridge | 5.43 |
| Torridge | 5.44 |
| West Devon | 5.60 |
| Torbay | 5.10 |
| South West | 5.42 |
| UK | 5.3 |
| Global average | 2.2 |
The average are of the population in Devon is 43.7 while in Torbay it is 44.2. This is above the average recorded in the South West (41.6) and England as a whole (39.3) (information sourced from Office for National Statistics 2013 – 2011 census ks102ew – age structure available here). The figure shows a higher than average proportion of the population above the age of 65 in both Devon and Torbay, reflecting in-migration, with proportions of those aged 0-15 and 16-29 below averages for both the South West and England.
The projected percentage change in population by age reflects an increasing life expectancy (Table 2) – (information source from the Office for National Statistics 2012, 2010 based subnational population projections by sex and quinary age). By 2031, 31% of Devon’s and 32% of Torbay’s populations are forecast to be aged 65 or above (information sourced from the Office for National Statistics (2012) – 2010 based subnational population projections by sex and quinary age).
The ‘ecological footprint’ is a proxy measure of the impact society has on the natural environment, based on an assessment of the area of land needed to supply the resources consumed by an individual and process their waste. The average footprint of Torbay’s and Devon’s population is over twice the global average (Table 3) ( information sourced from Stockholm Environment Institute 2008 REAP v2 experimental release 15.10.08 accessed 01.05.2013).
The ecological footprint of people in rural Devon is generally higher than those in Torbay and Exeter, most likely reflecting the higher dependence on car travel and electricity and oil for heating homes and businesses. The averages in Devon align to those for the South West but are above the UK average while those in Torbay and Exeter are below the South West and UK averages. The footprint is well above the defined sustainable productive area of 1.8 hectares per person (information source from european environment agency 2005 the ecological footprint: a resource accounting framework for measuring human demand on the biosphere, accessed 16.9.2013).
Health
General health data for Devon shows trends similar to those for the region and England, whilst Torbay has a lower proportion of people with very good health and a higher proportion of people with bad/very bad health (Table 4) (information sourced from the office for national statistics 2013, 2011 census qs302ew, general health, accessed 02.05.2013). Map 2 illustrates health deprivation in Devon and Torbay (information source from department for communities and local government – 2011, English indices of deprivation 2010, health deprivation and disability, accessed 01.05.13).
Map 2 – Health Deprivation by Lower Super Output Area
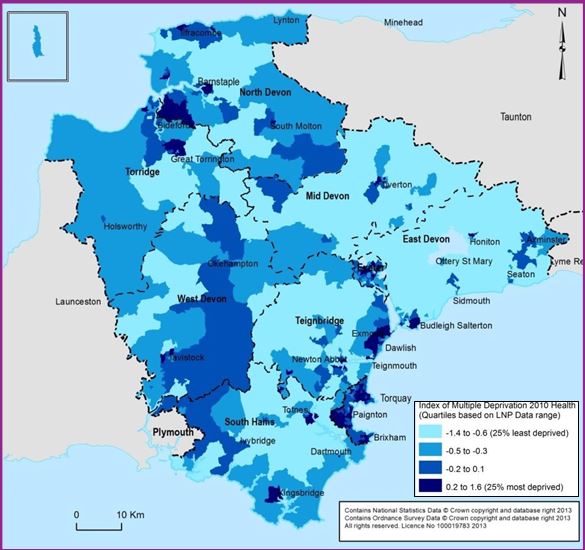
Table 4 – General Health (Percentage of resident Population)
| Very good | Good | Fair | Bad | Very bad | |
|---|---|---|---|---|---|
| Devon | 46.1 | 34.7 | 14 | 4 | 1.2 |
| Torbay | 41.7 | 34.4 | 16.3 | 5.8 | 1.7 |
| South West | 46.9 | 34.6 | 13.4 | 4 | 1.1 |
| England | 47.2 | 34.2 | 13.1 | 4.2 | 1.2 |
Economy
Economic information from the English Indices of Multiple Deprivation is illustrated in Map 3 ( THERE IS NOT A MAP 3)??? and shows the general geographic spread of economic deprivation across the study area.
The general condition of the Devon and Torbay economies can be shown through analysis of Gross Value Added (GVA)(in this instance, GVA is a measure data as shown in Figure 2
(information sourced from Office for National Statistics (2018) Regional gross value added income approach, 1997 – 2017) . As the trend suggests, the Devon economy has witnessed steady growth since 1997 (an increase of 102% between 1997 and 2015), whereas in Torbay GVA has increased by 45% over the same period.
Projections for GVA commissioned by Devon County Council in 2011
(information sourced from Cambridge Econometrics 2011, assembling the evidence base for the Devon Local Economic Assessment, accessed 02.05.13) expect GVA to grow at 3% per annum between 2015 and 2020. This is expected to be comparable with the wider south west.
Figures 3 and 4 (information source from the Office for National Statistics 2018, regional gross value added income approach – 1997-2017) show the composition of Torbay’s and Devon’s economies and offer a comparison between 1997 and 2015. Perhaps surprisingly, considering the rural character of Devon and Torbay and their strong maritime links, agriculture, forestry and fishing accounts for just 2% of the value of Devon’s economy in 2015 and 0.2% of Torbay’s; this has not changed significantly since 1997. Unsurprisingly, considering the Southwest’s reputation as a holiday destination, the distribution, transport, accommodation and food sector represents about 20 – 24% of both Devon’s and Torbay’s economies. During this time Torbay and Devon have experienced reductions in the value of the production and manufacturing sectors, which have been replaced with more dominant real estate and public administration, education and health sectors.
Figure 2 – Gross value-added trend 1997-2017
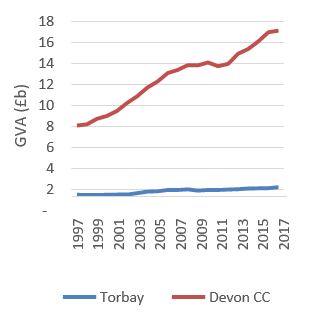
Figure 3 – Composition of Torbay’s economy by gross value added in 1997
![]() Industry 58%
Industry 58%
![]() Agriculture, mining, electricity, gas, water and waste 1%
Agriculture, mining, electricity, gas, water and waste 1%
![]() Manufacturing 7%
Manufacturing 7%
![]() Construction 2%
Construction 2%
![]() Distribution, transport, accommodation and food 9%
Distribution, transport, accommodation and food 9%
![]() Information and communication 1%
Information and communication 1%
![]() Financial and insurance activities 1%
Financial and insurance activities 1%
![]() Real estate activities 9%
Real estate activities 9%
![]() Business service activities 2%
Business service activities 2%
![]() Public administration, education and health 9%
Public administration, education and health 9%
![]() Other services and household activities 1%
Other services and household activities 1%
Figure 3 – Composition of Torbay’s economy by gross value added in 2017
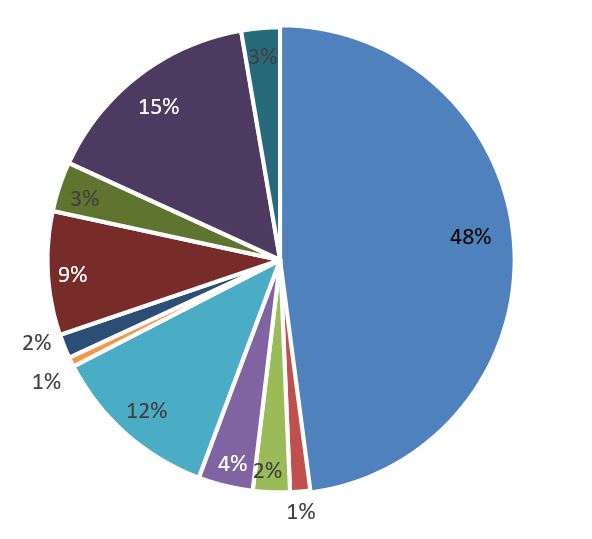
![]() Industry 48%
Industry 48%
![]() Agriculture, mining, electricity, gas, water and waste 1%
Agriculture, mining, electricity, gas, water and waste 1%
![]() Manufacturing 2%
Manufacturing 2%
![]() Construction 15%
Construction 15%
![]() Distribution, transport, accommodation and food 12%
Distribution, transport, accommodation and food 12%
![]() Information and communication 1%
Information and communication 1%
![]() Financial and insurance activities 2%
Financial and insurance activities 2%
![]() Real estate activities 9%
Real estate activities 9%
![]() Business service activities 3%
Business service activities 3%
![]() Public administration, education, health 15%
Public administration, education, health 15%
![]() Other services and household activities 3%
Other services and household activities 3%
 Figure 4 – Composition of Devon’s Economy by Gross Value Added in 1997

![]() Agriculture, forestry and fishing 8%
Agriculture, forestry and fishing 8%
![]() Manufacturing 12%
Manufacturing 12%
![]() Construction 6%
Construction 6%
![]() Distribution, transport, accommodation and food 19%
Distribution, transport, accommodation and food 19%
![]() Information and communication 3%
Information and communication 3%
![]() Financial and insurance activities 3%
Financial and insurance activities 3%
![]() Real estate activities 21%
Real estate activities 21%
![]() Business service activities 5%
Business service activities 5%
![]() Public administration, education and health 19%
Public administration, education and health 19%
![]() Other services and household activities 4%
Other services and household activities 4%
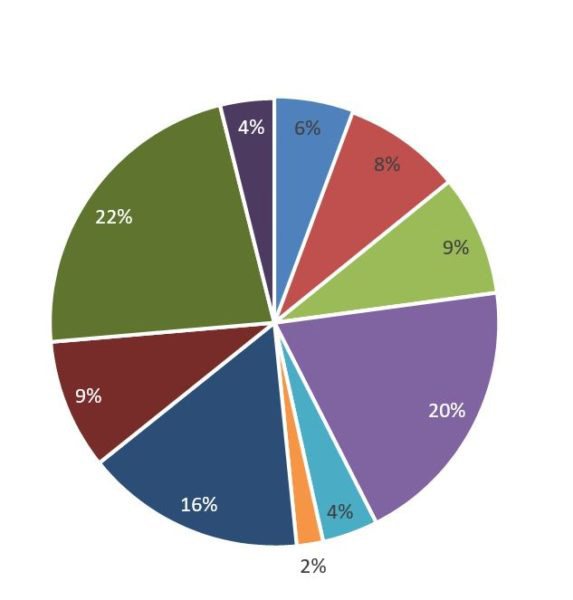 Figure 4 – Composition of Devon’s Economy by Gross Value Added in 2017
![]() Agriculture, forestry and fishing 6%
Agriculture, forestry and fishing 6%
![]() Manufacturing 8%
Manufacturing 8%
![]() Construction 9%
Construction 9%
![]() Distribution, transport, accommodation and food 20%
Distribution, transport, accommodation and food 20%
![]() Information and communication 4%
Information and communication 4%
![]() Financial and insurance activities 2%
Financial and insurance activities 2%
![]() Real estate activities 16%
Real estate activities 16%
![]() Business service activities 9%
Business service activities 9%
![]() Public administration, education and health 22%
Public administration, education and health 22%
![]() Other services and household activities 4%
Other services and household activities 4%